Unlock the Power of Data Visualization: Must-Read Books for Aspiring Analysts and Developers
Data visualization is more than just drawing pretty charts; it is the key to making sense of information and sharing insights in a powerful way. Here are some essential reads that will equip you with the knowledge to excel in this field!
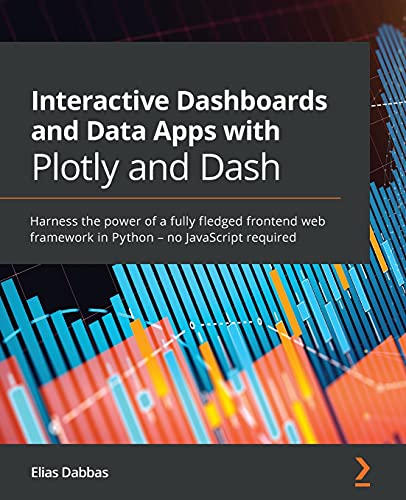
1. Interactive Dashboards and Data Apps with Plotly and Dash
Author: Elias Dabbas
This comprehensive guide teaches you how to leverage the full potential of Python’s Plotly and Dash libraries to create interactive dashboards. You don’t need to be a JavaScript expert to build stunning, user-friendly applications. With step-by-step examples and clear instructions, this book is a valuable resource for anyone looking to present data visually. Perfect for data analysts and developers alike, it empowers you to create apps that tell compelling stories with your data.
2. The Book of Dash: Build Dashboards with Python and Plotly
Authors: Adam Schroeder, Christian Mayer, Ann Marie Ward
This collaborative book dives deep into building dynamic dashboards with Python’s Plotly and Dash. It’s suited for both beginners and experienced developers looking to enhance their data interaction skills. The authors provide practical examples that guide you through the process while highlighting best practices in dashboard creation, making it essential reading for anyone aiming to advance their data visualization skills.
3. Plotly Tutorial for Beginners
Author: Ravi Prasad
This beginner-friendly guide walks you through the fundamentals of creating effective part-to-whole charts using Plotly Python. Whether you’re new to data visualization or looking to expand your skill set, Prasad’s clear explanations and hands-on tutorials provide a solid foundation on which to build. You’ll learn how to transform your data into meaningful visuals that resonate with your audience.
4. Interactive Web-Based Data Visualization with R, Plotly, and Shiny
Author: Carson Sievert
Bridging the gap between R and Python, this book showcases how to create compelling interactive web visualizations using Plotly and Shiny. It’s an incredibly useful resource for R programmers aiming to add a dynamic layer to their visualizations. With practical strategies and real-world examples, you’ll be able to bring your data to life and deliver insights that inspire action!
5. Python Data Visualization Using Plotly Framework
Author: Stephen G Schmitt
This accessible book is perfect for those who want to explore the Plotly package in Python deeply. It teaches you to create stunning visualizations and extract meaningful insights from your data. Priced affordably, it is an excellent starting point for budding data analysts who want a clear guide to mastering the Plotly framework without breaking the bank.
6. Data Visualization and Interactive Dashboards with Python
Authors: Dr. Sungjun Hong, Sungsoo Hong, Don Kim, Kyu Kim, Kyungtae Kim
This collaborative book focuses on the art of creating interactive dashboards using Python. The authors delve into advanced techniques that will elevate your data visualization projects and present data in an interactive format that engages users. A great addition to your reading list if you’re eager to impress stakeholders with meaningful data presentations.
7. Mastering Data Visualization: Matplotlib, Seaborn, Plotly, and Bokeh
Author: Dr. Muslum Yildiz
This comprehensive guide covers multiple Python libraries for data visualization, including Matplotlib, Seaborn, Plotly, and Bokeh. Dr. Yildiz provides a robust framework for mastering visualization concepts and techniques, making it a must-have resource for anyone serious about pursuing data science. The book serves as a reference for both beginners and advanced users aiming to manipulate and visualize data effectively.
8. Streamlit for Data Science – Second Edition
Author: Tyler Richards
Streamlit offers a unique way to build web applications for data science projects, and this book is your go-to guide! Tyler Richards walks you through building interactive data apps in Python, making it very approachable for data scientists who may not have extensive web development experience. Perfect for those looking to create user-friendly applications quickly and efficiently, this book helps you turn your data projects into impactful applications.
9. Python for Data Visualization: Creating Insightful Visuals with Matplotlib, Seaborn, and Plotly
Author: Nexus AI
This engaging resource takes you through the process of creating insightful visuals using three of Python’s most powerful libraries. Aimed at beginner to intermediate learners, this book delves into practical applications and helps you master skills that can elevate your data presentation. It’s both affordable and rich in content, making it an outstanding choice for anyone keen on improving their visualization skills.
10. Interactive Data Visualization with Python – Second Edition
Authors: Abha Belorkar, Sharath Chandra Guntuku, Shubhangi Hora
This insightful book focuses on presenting data in a compelling narrative style. The authors delve into the practices of creating data stories that resonate with audiences, transforming raw data into complete narratives. It’s an essential read for analysts who want to ensure their data-driven insights are not just heard, but felt.
By exploring these books, you’ll equip yourself with the knowledge and skills to create stunning visualizations that not only captivate but also inform your audience effectively. Pick a book that resonates with your current needs, and start your journey in mastering data visualization today!
