Visualizing Data: The Art of Clarity and Understanding
In today’s data-driven world, the ability to visualize complex information effectively is more crucial than ever. Visualization techniques serve not only as tools for presenting data but as vital instruments that facilitate deeper understanding, uncover trends, and support effective decision-making. From interactive dashboards to compelling infographics, the methods of displaying data have the power to transform raw numbers into clear narratives.
This blog post explores a handpicked selection of exceptional books that delve into visualization techniques in data. Whether you’re a beginner eager to learn foundational skills, or a seasoned professional seeking advanced strategies, these books cater to a wide range of needs. Join us as we uncover the must-reads that can elevate your data visualization game to new heights!
Featured Books
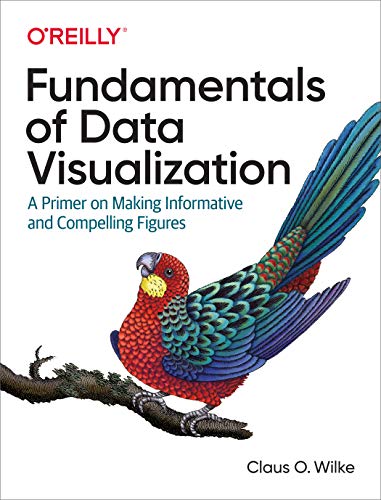
Fundamentals of Data Visualization: A Primer on Making Informative and Compelling Figures
Authored by Claus Wilke and published by O’Reilly Media, “Fundamentals of Data Visualization” presents clear guidelines for creating effective visual representations of data. This book is a treasure trove for both novices and seasoned data practitioners. It meticulously covers how to design charts and graphs that not only convey information but also engage the audience. With a balanced mix of theory and practical advice, this book empowers readers to think critically about their visual choices. Whether you’re preparing a presentation or developing a report, understanding the principles laid out in this primer can drastically improve the impact of your visuals.
Data Visualization Techniques (Trends in Software)
This comprehensive guide published by Wiley dives into a variety of data visualization techniques critical for software applications. It covers a spectrum of methods ranging from traditional charts and graphs to advanced interactive visualizations. Readers will find invaluable insights on how to leverage software tools to create compelling visuals that enhance data interpretation and stimulate discussions. By integrating solid statistical knowledge with practical visualization practices, this book helps you become adept at communicating data effectively.
Interactive Data Visualization: Foundations, Techniques, and Applications
This spirited book by Matt Schwartz offers an in-depth look at interactive data visualization. It combines foundational concepts with advanced interactive techniques that cater to both data novices and experienced developers. What sets this book apart is its practical approach—complete with coding examples and real-world applications. Whether you are looking to design engaging user interfaces for your data application or create dynamic reports, this book serves as a crucial guide to producing visually stunning and meaningful interactive visualizations.
Learning Neo4j 3.x: Effective data modeling, performance tuning and data visualization techniques in Neo4j
This book is essential for those looking to enhance their data visualization skills using Neo4j, a popular graph database. It intricately details effective data modeling and performance tuning, making it a crucial resource for database developers and data analysts alike. By going through this book, you will learn how to incorporate visualization techniques that make complex data relationships clear and comprehensible, allowing for better analysis and insights in your projects.
QGIS: Becoming a GIS Power User
If you are keen on mastering Geographic Information Systems (GIS), this book will empower you to become a QGIS power user. It lays out meticulous guidelines around data management, visualization, and spatial analysis techniques, making complex GIS concepts accessible. The visuals and frameworks illustrated in the book significantly aid comprehension and practical application of GIS tools, persuading decision-makers with powerful visual data storytelling.
Discrete Data Analysis with R
This book merges statistical theory with visualization techniques specifically for categorical and count data. It delves into using R, a powerful programming language, to visualize data trends effectively. If you are looking to enhance your analytical skills and leverage visualization to present results clearly, this book serves as a robust academic resource, bridging quantitative analysis and visualization seamlessly.
Mastering Data Visualization with Tableau
Tableau is a leading data visualization tool, and this book aims to equip readers with the skills needed to make impactful business decisions using it. This practical guide not only covers visualization fundamentals but also dives into advanced features of Tableau that can help in displaying critical business metrics compellingly. A must-read for professionals wishing to leverage data in their decision-making processes!
Functional Data Analysis in Biomechanics
Combining data visualization with biomechanics, this concise review book explains core techniques, applications, and emerging areas. Its focus on functional data analysis presents readers with new angles in visualization, marrying theory with practical applications. If you’re involved in biomechanics or similar fields, this book can offer unique insights on how visualization techniques are pivotal in making sense of complex data sets.
Dear Data: A Friendship in 52 Weeks of Postcards
“Dear Data” creatively merges data visualization with personal storytelling. Through a year-long exchange of postcards, the authors transformed everyday life data into beautifully illustrated visual expressions. This innovative approach showcases the human side of data, making it a unique and inspiring read that emphasizes visualization’s power in sharing personal narratives. A refreshing perspective on how data can tell stories!
Introduction to Python: Important Points of Visualization Techniques in Data Analysis
This practical guide introduces readers to Python’s visualization capabilities, highlighting essential techniques for data analysis. It’s an excellent resource for beginners keen on harnessing Python to visualize data effectively. The book addresses essential libraries and tools that simplify the visualization process, allowing readers to dive right into crafting informative graphics from their datasets.

