Understanding the Power of Visualization
In today’s data-driven world, visualization takes center stage in how we comprehend complex information. Whether it’s scientific data, climate models, or educational tools, the ability to convey knowledge through compelling visuals is crucial. Visualization not only makes data more accessible but also enhances our capacity to analyze and interpret findings effectively. As we delve into science, the right tools can transform dull datasets into engaging, clear narratives that empower decision-making and spark innovation.
This blog post highlights several must-have books focused on visualization in science, covering various aspects from theoretical foundations to practical applications. Each title offers unique insights aimed at anyone keen on harnessing the power of visualization—be it for professional development, academic pursuits, or personal enrichment.
Book Reviews
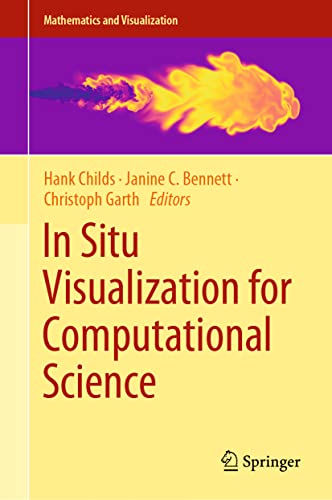
In Situ Visualization for Computational Science (Mathematics and Visualization)
Embark on an in-depth journey with In Situ Visualization for Computational Science, a powerful resource published by Springer. This book stands as a pinnacle of understanding visualization techniques specifically tailored for computational sciences. It dives into innovative methodologies that allow scientists to visualize data on-the-fly, enhancing real-time analysis and decision-making. With comprehensive theoretical perspectives and practical implementations, it serves as an essential reference for researchers and graduate students alike. Discover how visualization can amplify the impact of your scientific computations and foster breakthroughs.

Statistics and Data Visualization in Climate Science with R and Python
Statistics and Data Visualization in Climate Science with R and Python is a crucial guide for those looking to fuse statistical analysis with visualization techniques in climate science. This imaginative publication from Cambridge University Press provides techniques and tools that help clarify the ever-complex climate phenomena. By integrating R and Python, it enables readers to harness powerful coding skills, allowing for insightful data manipulation and stunning visual displays. This book is perfect for researchers, practitioners, and students passionate about climate data visualization.

Data Analytics & Visualization All-in-One For Dummies
Step into the world of data with Data Analytics & Visualization All-in-One For Dummies. This user-friendly guide serves as a comprehensive resource for novices and experts alike. It unpacks the mechanisms behind data analytics and visualization in a straightforward and approachable way. Readers will learn fundamental techniques, tools, and best practices that are essential in today’s analytical landscape. This is not just a book; it’s a practical handbook that demystifies the world of data and empowers anyone to convey insights with clarity and confidence.

Data Visualization in Excel: A Guide for Beginners, Intermediates, and Wonks
If you’re eager to expand your knowledge in data visualization tools, Data Visualization in Excel is the guide you need. This book focuses on a familiar tool, Excel, to teach essential visualization techniques ranging from beginner to advanced levels. By employing practical examples and clear explanations, readers will quickly grasp how to transform mundane spreadsheets into visually appealing and informative graphics. It’s an ideal resource for anyone in the business world seeking to elevate their data presentation skills.

Data Visualization in R and Python
Data Visualization in R and Python showcases the synergy between two powerful programming languages tailored for data analysis and visualization. This essential guide teaches readers to utilize R and Python to create visually stunning representations of data while discussing key principles of effective visualization. It’s not only a technical manual but also a source of inspiration for developers and data scientists eager to explore advanced visualization techniques. This is a must-have for anyone looking to enhance their data storytelling capabilities.

Data Analytics, Data Visualization & Communicating Data: 3 books in 1
This exceptional collection, Data Analytics, Data Visualization & Communicating Data, integrates three powerful texts that guide readers through the fundamental processes of data analytics. As a bundle, it covers everything from initial data exploration to successful communication of insights. By addressing the full spectrum of analytics and visualization, this book is tailored for anyone interested in mastering the art of data communication.

Visualization in Science Education (Models and Modeling in Science Education, 1)
The Visualization in Science Education book is a vital resource that discusses the importance of visualization in the educational landscape of science. Highlighting various modeling techniques and visual aids, it illustrates how educators can enrich the learning experience and enhance students’ understanding of complex concepts. This is an important read for educators and curriculum developers focused on integrating effective visualization strategies in science education.

Storytelling with Data: A Data Visualization Guide for Business Professionals
Storytelling with Data transcends traditional data visualization by weaving storytelling techniques into visual communications. This powerful guide positions business professionals to convey compelling narratives through their data, making it a key tool in any data-driven organization. With practical examples and a clear process, it equips readers with the skills necessary to present their data in a way that resonates with audiences. This book is indispensable for those looking to make data-driven presentations come alive!

Flow Boiling in Microgap Channels: Experiment, Visualization and Analysis
This engineering-focused title, Flow Boiling in Microgap Channels, takes a specialized look at experimental and visualization methods within specific scientific contexts. Aimed at professional audiences, it presents advanced concepts with clarity and thorough explanations, making it an excellent addition for researchers in the field. It’s especially useful for those engaging with fluid dynamics and related disciplines.

Building Science Graphics: An Illustrated Guide to Communicating Science through Diagrams and Visualizations
Building Science Graphics presents a detailed approach to integrating graphics into scientific communication. It serves as an illustrated guide that helps professionals create informative diagrams and visualizations effectively. By bridging graphics and technical information, it shows how to enhance clarity and engagement in scientific presentations. An essential resource for scientists and educators seeking to improve communication through visuals.