Unlock Your Data’s Potential: Explore Visualization Techniques in Data
In an era where data drives decision-making, understanding how to effectively visualize this information is more critical than ever. The right visualization techniques can transform complicated datasets into compelling stories, allowing audiences to grasp insights quickly and intuitively. Whether you’re a data scientist, a business analyst, or someone keen on enhancing your data literacy, mastering visualization techniques can enhance your communication and proficiency in conveying analysis results.
This blog post guides you through a selection of the most insightful books on data visualization techniques. Each featured book offers distinct approaches and methodologies, aiming to equip you with the knowledge you need to mesmerize your listeners and readers. Dive in, and find the resource that resonates the most with your data visualization journey!
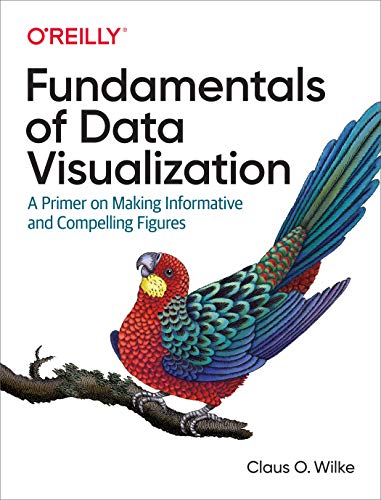
1. Fundamentals of Data Visualization: A Primer on Making Informative and Compelling Figures
Author: O’Reilly Media
This essential book focuses on the core principles of data visualization, exploring how to create figures that are not only informative but also compelling. With a strong theoretical base, it delves into how to choose the appropriate visualization techniques for different types of data and audiences. The structured guidance provided will help you create visuals that turn data into impactful insights.
From understanding your audience’s needs to mastering design elements, this book provides practical takeaways, numerous examples, and exercises to enhance your skills. It is a must-have for anyone looking to solidify their foundation in data visualization.
2. Data Visualization Techniques (Trends in Software)
Publisher: Wiley
This extensive guide covers various data visualization methods in software development, making it ideal for individuals looking to strengthen their analytical skills in programming contexts. The book dives deep into the essential techniques that every data professional should know, including software tools that can refine your data visualization processes.
Readers will find valuable insights on best practices, case studies, and software applications necessary to effectively showcase data. This book is pivotal for those developing a software-centric skill set in data visualization.
3. Interactive Data Visualization: Foundations, Techniques, and Applications
Publisher: A K Peters/CRC Press
This book is perfect for readers interested in interactive data visualization. It combines theory with practical insights, teaching readers about the foundational principles behind creating interactive visual content. You’ll learn not just how to visualize data but how to engage your audience actively.
The book is filled with examples, best practices, and methodological frameworks that will guide you through the complexities of interactive visualizations, making it indispensable for anyone working with data on a professional level.
4. Learning Neo4j 3.x: Effective data modeling, performance tuning and data visualization techniques in Neo4j
Publisher: Packt Publishing
If you’re interested in graphical databases, this book offers profound insights into Neo4j and how to effectively visualize connected data. It covers data modeling and visualization techniques that are essential for optimizing performance and data representation.
As industries increasingly adopt graph databases, this book provides a timely resource for both beginners and experienced practitioners looking to improve their data modeling stratagems using Neo4j.
5. QGIS: Becoming a GIS Power User
Publisher: Packt Publishing
This guide is designed for anyone aiming to master data management and visualization techniques in QGIS, an essential software for geospatial professionals. The book provides exhaustive coverage of spatial data analysis combined with data visualization, enabling readers to become proficient users of GIS technology.
If you’re looking to elevate your skills in spatial data analysis with visual context, this book is invaluable. It provides not only fundamental knowledge but also advanced techniques to take your GIS capabilities to the next level.
6. Discrete Data Analysis with R: Visualization and Modeling Techniques for Categorical and Count Data
Publisher: Chapman and Hall/CRC
As a vital resource for R users, this book integrates visualization techniques with R programming for discrete data analysis. It emphasizes practical implementation of visualization techniques, demonstrating how to effectively display categorical data using R’s robust graphics capabilities.
Whether you’re a statistician or a R enthusiast, this book can enhance your programming prowess, allowing you to create stunning and informative visualizations in your projects.
7. Mastering Data Visualization with Tableau
Publisher: BPB Publications
Tableau is a powerful visualization tool, and this book serves as an excellent guide to mastering its capabilities. Readers will learn how to translate data into visuals that generate actionable insights and business decisions.
The comprehensive approach allows you to utilize Tableau effectively, benefitting anyone involved in data-driven decision making in their organization.
8. Functional Data Analysis in Biomechanics
Publisher: Springer
This book focuses on specific applications of functional data analysis in biomechanics, offering insights into a niche that combines data visualization and theoretical principles. Readers will discover methodologies to transform biomechanical data into clear, understandable visual outputs.
If biomechanics is your field, this book can, therefore, provide the specialized knowledge needed to analyze and visualize complex functional data effectively.
9. Dear Data: A Friendship in 52 Weeks of Postcards
Publisher: Princeton Architectural Press
This unique book takes a creative approach to data visualization through a series of postcards exchanged between two friends. It combines art and data analytics, inspiring readers to consider the social aspects of data representation.
For those looking for an artistic and innovative take on data visualization, this book stands out as a remarkable example of how data can enrich personal narratives and friendships.
10. Introduction to Python: Important points of visualization techniques in data analysis
Publisher: Shinzan Palette
This introductory book covers the essential visualization techniques using Python primarily aimed at beginners. It simplifies the process of tackling data analysis with Python, making it accessible for those without an extensive background in programming.
If you’re keen on starting your data visualization journey with Python, this book provides clear guidance and foundational knowledge perfectly suited for novice data enthusiasts.

