Top 10 Essential Python Books for Data Visualization Enthusiasts
Data visualization is an indispensable skill in the world of data science and analytics. The right literature can pave the way for mastering these skills. Here are ten fantastic books that every Pyhtonistas looking to enhance their data visualization should not miss.
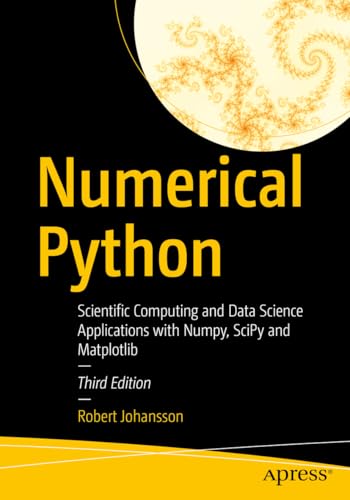
1. Numerical Python: Scientific Computing and Data Science Applications with Numpy, SciPy and Matplotlib
Author: Robert Johansson
This book is a comprehensive guide to scientific computing in Python. It captures both the essence of numerical computation and its applications in data science effectively. With detailed insights into NumPy, SciPy, and Matplotlib, it offers practical examples that bring theoretical concepts to life. Whether you’re just starting or seeking to refine your skills in scientific computing, this book is an invaluable resource.
2. Data Visualization in Python with Pandas and Matplotlib
Author: David Landup
This book dives deeply into the art of data visualization using two of Python’s most powerful libraries: Pandas and Matplotlib. With clear explanations and practical examples, it empowers readers to create informative and aesthetic visualizations. This is a perfect fit for anyone looking to enhance their ability to convey data insights visually.
3. Matplotlib Programming In 8 Hours, For Beginners
Authors: Ray Yao, Netty Flask C., Ado D. Pytorch
This concise guide is designed specifically for beginners who want to learn how to program with Matplotlib efficiently. It offers a crash course with exercises that help solidify your knowledge quickly. Ideal for individuals with limited time, this book makes learning practical and engaging, ensuring you can produce beautiful charts in no time.
4. Python Data Analytics: With Pandas, NumPy, and Matplotlib
Author: Fabio Nelli
In this compelling read, Nelli discusses how to extract insights and analyze data using Python’s most popular libraries. This book takes a hands-on approach, enabling readers to conduct real-world data analytics projects. From basic concepts to advanced analytics techniques, it’s a must-read for aspiring data scientists looking to bolster their skills.
5. Matplotlib 3.0 Cookbook
Author: Srinivasa Rao Poladi
This Cookbook is packed with over 150 recipes, making it an essential guide for anyone looking to master Matplotlib. Each recipe is backed by detailed explanations that make complex topics understandable. It’s an ideal resource for developers wanting to create highly detailed interactive visualizations with ease and efficiency.
6. Ultimate Python Libraries for Data Analysis and Visualization
Author: Abhinaba Banerjee
This book serves as a comprehensive guide to Python libraries essential for data analysis and visualization. It covers a range of tools, including Pandas, NumPy, and Matplotlib, among others. Readers will learn how to leverage these libraries to extract insights and make informed decisions based upon their analyses. A practical guide for professionals and enthusiasts alike!
7. Matplotlib for Python Developers
Author: Sandro Tosi
This book caters specifically to Python developers who want to create visually appealing plots effortlessly using Matplotlib. With a focus on best practices and clean coding, Tosi helps streamline the development process, enabling developers to produce high-quality visual representations that can be leveraged in research and presentations.
8. Data Visualization in Python with Matplotlib: The Complete Guide
Author: Bob Villa
Bob Villa’s guide provides readers with a thorough understanding of Matplotlib, helping them to master this powerful visualization library. It covers a comprehensive range of topics, from the basic fundamentals to advanced plotting techniques. Readers will appreciate the lucid explanations and practical examples provided throughout this fantastic resource.
9. Python Data Cleaning Cookbook
Author: Michael Walker
In the modern data landscape, cleaning data is just as important as analyzing it. This cookbook offers practical recipes and strategies to prepare data effectively using tools like Pandas and NumPy. Walkers hands-on approach equips you with the skills necessary to get your data analysis projects off the ground, making this book a valuable addition to any data analyst’s library.
With these exceptional books, readers can not only learn the theory but also engage in practical exercises that can be applied in real-world scenarios. Start your journey in the world of data visualization today!
