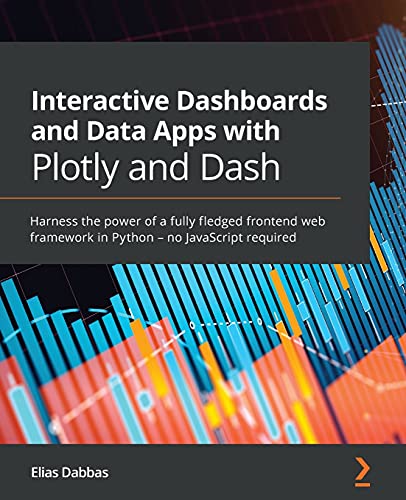
1. Interactive Dashboards and Data Apps with Plotly and Dash
Authored by Elias Dabbas, this book is a comprehensive guide to building interactive dashboards and data applications using Python. It provides readers with the necessary tools to navigate through the complexities of front-end development without the need for JavaScript. The book is rich with practical examples and exercises that help to solidify your understanding of Plotly and Dash. You’ll learn how to create visually appealing, insightful dashboards that can drive decision-making in a business environment. If you aim to enhance data interactivity within your applications, this book is a must-read. It not only introduces you to key concepts but also empowers you to harness the power of data visualization effectively.
2. The Book of Dash: Build Dashboards with Python and Plotly
Co-authored by Adam Schroeder, Christian Mayer, and Ann Marie Ward, this book delves into the intricacies of building comprehensive dashboards using the Plotly and Dash libraries. The authors break down complex topics into easily digestible sections, making it beginner-friendly while still offering valuable insights for more experienced users. You’ll be equipped with the skills necessary to visualize data fluidly and cohesively, making this an essential read for anyone looking to create dynamic visual representations of data on the web. Moreover, it encourages vibrant interaction with data, making analysis intuitive and engaging.
3. Data Visualization and Interactive Dashboards with Python
This upcoming release, authored by Dr. Sungjun Hong and his team, is set to be a game-changer in the sphere of data visualization. Slated for publication in early 2024, this book addresses the growing need for advanced visualization techniques that make data interpretable at a glance. It promises to guide readers through the process of developing interactive dashboards and offers insights on leveraging Python’s capabilities for data analysis. For those eager to stay ahead in the field, this book will be a perfect addition to your library.
4. Plotly Tutorial for Beginners
Ravi Prasad’s guide, priced at only $9.55, is an excellent introduction for those who are new to the Plotly ecosystem. This tutorial breaks down the basics of data visualization in Python, making it accessible for beginners looking to enhance their data stories. It provides a clear path from foundational knowledge to implementing full-fledged data visualizations. The concise structure of the book makes it easy to follow along, allowing readers to grasp essential concepts quickly. If you’re just starting with Plotly, this tutorial is a perfect springboard into the world of data visualization.
5. Advanced Visualization Techniques in Python (Japanese Edition)
For advanced users looking to push the envelope on their visualization skills, Rin Sakakuni’s book offers a dive into sophisticated techniques using Plotly and Dash. It bridges the gap between basic visualization and effective storytelling through data. Readers will learn about best practices and hidden secrets that capture the audience’s attention. This book is crucial for individuals aspiring to present data professionally and creatively, especially within a Japanese-speaking context. The emphasis on interactivity sets this book apart and enables users to create engaging visual displays.
6. Tips for Interactive Data Visualization in Python (Multiple Editions)
This series of books, covering several aspects of interactive data visualization in Python, focuses on practical tips and techniques to make your dashboards not only functional but also visually appealing. Each edition offers something unique, whether it’s dynamic data analysis or business intelligence tool development. They are essential readings for data professionals who want to enhance their skills and make impactful data-driven decisions. These books are concise, rich in content, and suitable for quick reference.

