Understanding Data Visualization in Science
In an increasingly data-driven world, the ability to effectively visualize information has never been more crucial. Data visualization combines the intricate art of design with the analytical power of statistics, allowing researchers and professionals to transform complex datasets into understandable visuals that drive insights and inform decisions. Whether you’re a scientist, a business analyst, or a student, mastering data visualization techniques can elevate your work and enhance communication with your audience.
This blog post highlights key literature that focuses on data visualization within the scientific and analytical context. The books featured here provide not only foundational knowledge but also advanced techniques tailored for various expertise levels. With hands-on examples and practical insights, each title equips you with the skills necessary to tell compelling stories through data.
Featured Books
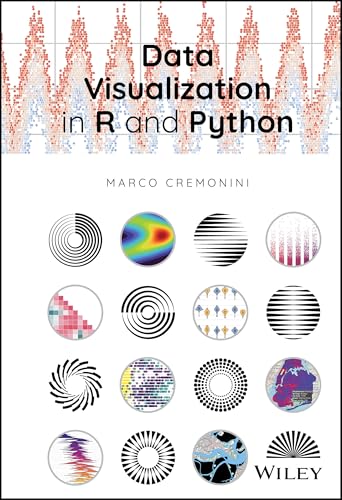
Data Visualization in R and Python
Data Visualization in R and Python is a comprehensive resource that serves as an essential guide for anyone looking to harness the power of these programming languages for data visualization. Authored by the experts at Wiley, this text delves into how to effectively present complex data using graphical representations, ensuring clarity and precision in your findings. This book is perfect for data scientists and researchers who want to enhance their proficiency in data representation. By integrating visual tools with statistical analysis, readers gain invaluable insights, not only improving their skills but also making their data narratives resonate. If you seek to turn intricate datasets into impactful visuals, this book is an indispensable addition to your library.

Data Analytics & Visualization All-in-One For Dummies
This guide from For Dummies covers a wide range of principles and practices regarding data analytics and visualization, making it an excellent resource for both novices and seasoned data professionals. With over 800 pages filled with insights, it demystifies complex concepts and equips the reader with practical tools to analyze and visualize data. Readers will appreciate the friendly yet informative tone and the step-by-step approach that makes learning accessible. With a focus on real-world applications, this book promises to enhance your data analytics skills significantly while providing insights on tools and techniques across various platforms.

Data Visualization in Excel: A Guide for Beginners, Intermediates, and Wonks
This guide, part of the AK Peters Visualization Series, provides a detailed exploration of using Excel to create insightful visualizations. Authors of this book step through the core principles of visualization and how they can be applied specifically in Excel, a widely used tool in business and academia. The illustrated examples and clear instructions cater to a range of skill levels, ensuring that everyone from novices to more experienced users can find value here. This book is indispensable for those who want to maximize the capabilities of Excel and present data insights in a compelling manner.

Statistics and Data Visualization in Climate Science with R and Python
This book is tailored for those engaged in climate science but is rich in statistical analysis and data visualization techniques that anyone can benefit from. It combines hands-on R and Python code with practical applications to demonstrate how effective visualization can lead to deeper insights into climate data. Researchers will find this book enlightening, especially as it guides them through intricate datasets and demonstrates how to visualize complex models elegantly and informatively. It’s an important read for anyone focused on climate studies or data science.

Storytelling with Data: A Data Visualization Guide for Business Professionals
This book by Cole Nussbaumer Knaflic is a timely reminder that data visualization is not just about aesthetics; it’s also about storytelling. Knaflic emphasizes the importance of presenting data with intention and clarity, making it an indispensable resource for business professionals tasked with conveying insights to stakeholders. The engaging narrative coupled with practical techniques makes this book a favorite among managers and analysts alike. By weaving together principles of design, data, and storytelling, this book truly elevates your ability to communicate findings effectively.


